
New possibilities created by crime survey wave integration

The Crime Survey for England and Wales (CSEW) and its predecessor, the British Crime Survey (BCS), are widely used by both academics and government to assess the level of crime and its impact on society. While the survey has run since 1982, combining the multiple years of the survey can be complex and mistakes are easily made. As a researcher in criminology who frequently uses the CSEW and its predecessor, I have produced detailed Stata code to combine data from multiple survey years to support other researchers who also analyse the CSEW in Stata (or would like to start). I worked with the UK Data Service (UKDS) and the Office for National Statistics (ONS) to share the code and develop guidance for its use.
With this code, you can specify what you need, namely, which years of the Crime Survey you want to merge and if you want the adolescent and young adult panels, the bolt-on datasets that provide uncapped codes, and/or if you want to use the ethnic minority booster samples. As a result, the code can be easily tailored for each researcher’s needs.
By combining multiple survey sweeps, analysts can examine temporal trends. A combined file also enables analysts to look at low prevalence offences, population groups, or consequences, that do not have a high enough frequency in a single year.
Two examples are given below on how this integrated dataset provides new and exciting opportunities.
The code can be downloaded via this link: https://reshare.ukdataservice.ac.uk/856494/
Example 1: Revealing gender and age differences in trends in experiencing violence
We used our integrated crime survey dataset to examine temporal trends in different types of violence, and whether these varied by gender and age.
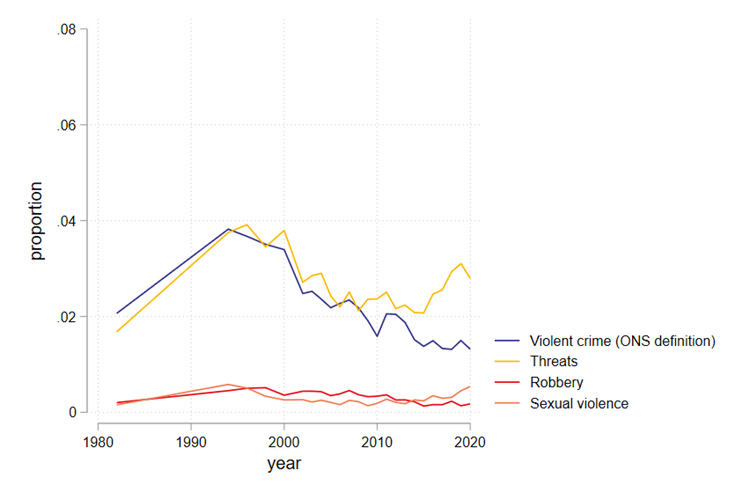
After a rise in violent crime in the 1980s, there was a decade of steady decline followed by a decade of stability (blue line, Figure 1a). However, for other crimes, which can also be considered violent, the patterns observed are different. After a short period of decline in the 1990s, sexual violence against women remained relatively stable until around 2010 when it began to increase, reaching the 20 years high by 2020. Additionally, there has been a sharp rise in threats reported by women in the last 5 years of data, making threats almost as prevalent as at its peak in the late 1990s.
The trends in violent crime for men follow a broadly similar pattern as for women, but at a higher rate. Unlike women, however, men did not experience an increase in threats in the more recent period.
Figure 1. Prevalence of violence by type of violence and gender, 1982 to 2020
a) Proportion of women experiencing violence by type of violence
b) Proportion of men experiencing violence by type of violence
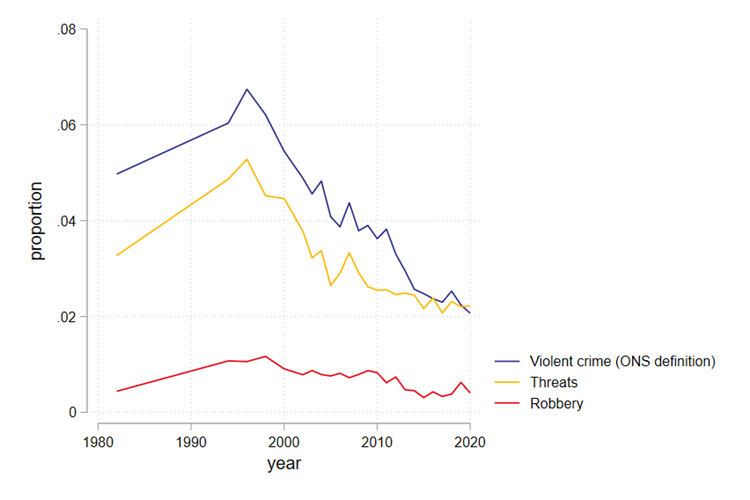
Source: Authors’ analysis using CSEW/BCS data from 1982 to 2019/2020.
Notes: Weighted proportions. Violent crime includes the following offences: Serious wounding, other wounding, common assault, attempted assault, serious wounding with sexual motive, other wounding with sexual motive. Sexual violence includes the following offences: rape, attempted rape and indecent assault. Due to low frequencies, sexual violence is not reported here for men.
Figure 2 reveals that there has been major change in the age profile of victims over the past 40 years. 16- to 19-year-olds were almost 3 times as likely to become a victim of violence as people aged 30 to 39 in the mid-1990s. But violence against this group has declined rapidly since then: while they continue to be the group that is most likely to be victim of violence with 7.2% annual victimization in 2020, this used to be over 28% in the mid-1990s. While risk of violence has declined for all the ages under 40, the shift has been the largest for the younger groups.
Relatively few people over 50 become victims of violence compared to younger age groups in each time period. However, closer inspection reveals there is a significant increase in the risks of violence among the older age groups (60-69 and 70 and older) since the late 1990s, and particularly since 2015.
Overall, the age profile of victims has shifted massively over the decades, there is now much less variation in rates between age groups.
Figure 2 Prevalence of violence (including violent crime, threats, robberies, and sexual violence) by age group, 1982 to 2020.
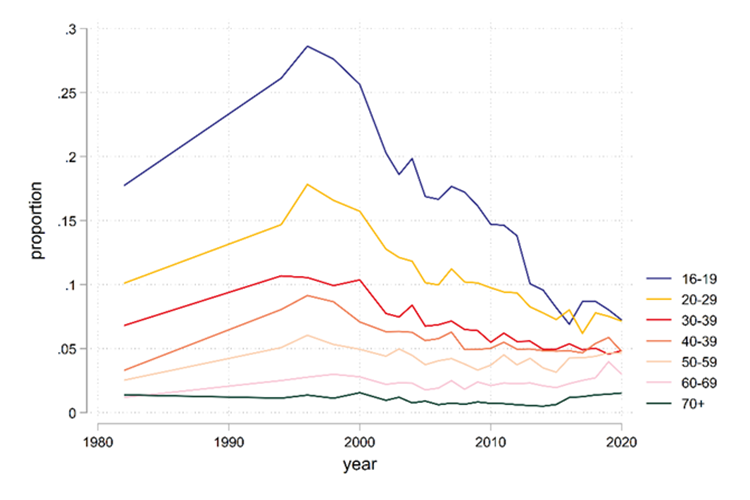
Source: Authors’ analysis using CSEW/BCS data from 1982 to 2019/2020.
Example 2: Investigating smaller groups: Differences in wellbeing impact between intimate partner perpetrators
Our integrated crime survey dataset allows for the study of minority groups that are relatively small or forms of violence that are not often reported.
For example, only by combining twenty years of the crime survey (2001 to 2020) do we have sufficient sample size to study the impact physical intimate partner violence has on wellbeing and health, and how it differs between various types of intimate partner perpetrator.
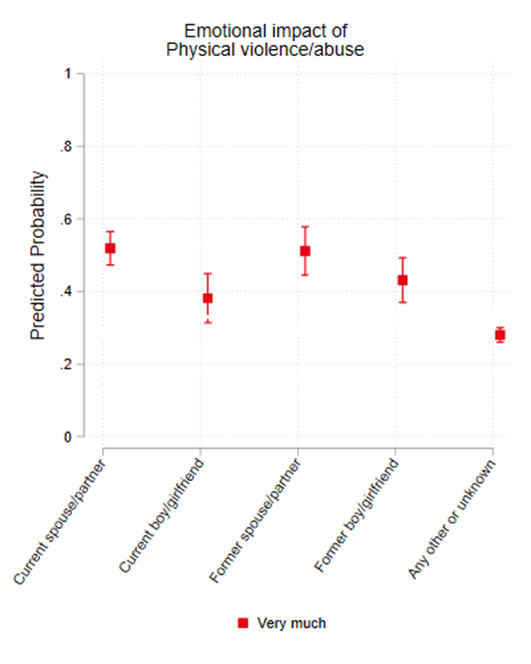
Firstly, it is important to note that physical violence by any type of intimate partner has a higher risk of high emotional impact (Figure 3a) and a higher risk of injury (Figure 3b) than violence by other types of perpetrators.
Figure 3a below shows that the emotional impact reported by female victims is higher when the violence was committed by a current or former spouse/partner compared to if it was done by a current or former boy/girlfriend. Women were more likely to say they were ‘very much’ affected by the violence when it was committed by a current or former spouse/partner. It could be that the proximity of spousal relationships, which are often cohabitating, and their average longer duration account for some of the greater report impact. However, in contrast to emotional impact, figure 3b (below) shows that women are more likely to get an injury(ies) by violence by current spouses than by former spouses.
Overall, this study highlighted that physical violence by an intimate partner has a more severe wellbeing and health impact than violence by others, but also the need to differentiate intimate partner violence and abuse by not only the type of violence/abuse but also the type of intimate partner.
Figure 3 Estimated emotional wellbeing and risk of injuries for women following physical intimate partner violence, differences between intimate partner perpetrators.
a) Respondent’s reported emotional impact (showing the highest category).
b) Respondent’s reported physical health impact (showing the risk of injury)
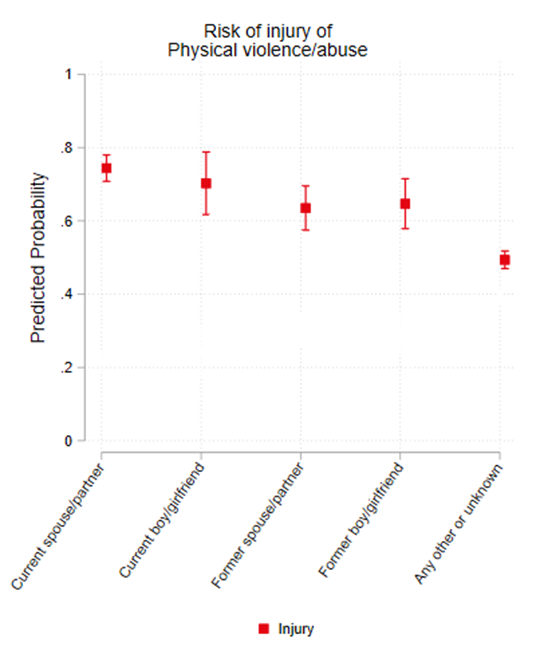
Source: Authors’ analysis using CSEW/BCS data from 2001 to 2019/2020.
Notes: Respondent’s self-assessed emotional impact measured in four categories: not impacted, little impact, quite a lot, very much impacted. Respondent’s self-assessed risk of injuries is measured in three categories: no force was used, force was used but no injury was sustained, force was used that led to an injury. Figures are based on average marginal effects following ordered logit models controlling for key (socio)demographics. Significance was tested in additional models.
What the merger code does and doesn’t do
The Stata code enables users to merge the raw CSEW/BCS datasets. Consequently, at the moment, this code does not harmonize variables that change (slightly) over different years. Considering the measurement of many variables changes over the years, the users of this combined file need to make their own decisions on what operationalisations work best for their research and for the years they use.
Most of the time new variable names are used when a new measurement is used. However, for a few variables, different measurements seem to be used in different years, but they have the same variable name (for instance for household income variables such as tothhin2). In the current code, these variables are treated as being the same. Therefore, users need to carefully check the variables that they use for the relevant years.
Next, this code does not work in the secure researcher environment as provided by UKDS or ONS because the datasets in these environments have different names and the structure of the folders is different.
Overall, the merger code will save researchers precious time in combining the surveys that they want to use. As we have shown here, combining survey sweeps can benefit the study of trends in victimisation. The code can also be used for studying groups or crimes that are too rare to study using only a single sweep, therefore, this code may provide an incentive for studying marginalised groups and specific crimes, contributing to new insights into victimisation.
Citation for merged code
Blom, Niels (2023). Code for Merging Waves of the Crime Survey of England and Wales and the British Crime Survey, 1982-2020. [Data Collection]. Colchester, Essex: UK Data Service. 10.5255/UKDA-SN-856494
Examples in this blog are from
Blom, N., Obolenskaya, P., Phoenix, J., and Pullerits M. (2023, September 11-13). Differentiating intimate partner violence by perpetrator relationship type. Types of crimes committed and consequences for victims’ health and wellbeing by different types of intimate partner perpetrators [Conference Presentation]. European Conference on Domestic Violence, Reykjavik, Iceland.
Obolenskaya, P. & Blom, N. (2023, September 6-9). The rise, fall and stall of violence in England and Wales: how have risks of violence changed for different groups? [Conference Presentation]. EuroCrim 23rd Annual Conference of the European Society of Criminology, Florence, Italy.
Data reference
Office for National Statistics. Crime Survey for England and Wales, 2001-2002 to 2019-2020 and British Crime Survey 1982 to 2001 [data collections]. UK Data Service SN: 8812, 8608, 8464, 8321, 8140, 7889, 7619, 7422, 7252, 6937, 6627, 6367, 6066, 5755, 5543, 5347, 5324, 5059, 4787.
For further information, please contact Niels at niels.blom@city.ac.uk
Photo by Andre Lichtenberg